Monday, October 21, 2019

⭐UNIT 3! Aggregate Demand

Aggregate Demand Curve
Image result for aggregate demand curve picture
AD is the demand consumers, businesses, government, and foreign countries.

Changes in price level cause a move along the curve not a shift of the curve

Aggregate Demand

  • shows the amount of real GDP that the private public and foreign sector collectively desure to purchase at each possible price level.
  • the relationship of price level and level of real GDP is inverse
3 reasons why AD is downward sloping

1. Wealth Effect

  • higher prices reduce purchasing power of $
  • This decreases the quantity of expendetures.
  • lower price levels increase purchasing power and increase expendetures
2.Interest Effect
  • as price level increases,lenders need to charge higher interest rates to get REAL return on their loans
  • higher interest ratesd discourage consumer spending and buisiness investment.
3.Foreign trade effect
  • when the U.S price level rises, foreign buyers purchase fewer U.S goods and Americans buy more foreign goods.
  • Exports fall and imports rise causing Real GDP demand to fall
Shift in Aggregate Demand
  • There are two parts to a shift in AD
-A change in C,I,G, and or Xn
-A multiplier effect that produces a greater change than the original change in the 4 components

Increases in AD=AD→
Image result for increases in aggregate demand

Decrease in AD=AD←
Image result for decreases in aggregate demand

Determinants of AD
  • Consumption (C)
  • Gross Private Investment (Ig)
  • Government Spending (G)
  • Net Exports (Xn) Exports - Imports (X-M)
Breakdown..

1. Change in Consumer Spending (C)

Consumer wealth (Boom in stock market)
Consumer expectations (People fear a recession)
Household Indebtness (more consumer debt)
Taxes (Decrease in income taxes)

2 Change in investment spending (Ig)

real interest rates (price of borrowing $)
(If interest rates increase)
(If interest rates decrease)
Future business Expectations (High expectations)
Productivity and technology (New robots)
Business Taxes (Higher corporate taxes means...)

3.Government Spending (G)
(War)
(Nationalized Health care)
(Decrease in defense spending)

4. Change in Net Exports (X-M)

Exchange rates
(If the U.S dollar depreciates relative to the euro)
National Income Compared to abroad
(If major importer has a recession...)
(If the U.S has a recession...)
"If the U.S get a cold, Canada gets Pneumonia"
AD=GDP=C+I+G+Xn

Government Spending
  • More government spending (AD→)
  • Less government Spending (AD←)


Thursday, October 17, 2019

Unemployment

Population: Number of people in a country total.

Labor Force: Number of people in a country that
is either employed or unemployed.

1.) Able and willing to work.
2.) Must be 16 years of age and older.
3.) You must work at least one hour
every 2 weeks.

Unemployed: People 16 years of age and older
older that do not have a job.

Unemployment : Failure to use available resources
particularly labor to produce desired goods and services.

Underemployment: Not giving full effort.

Unemployment rate formula :

Unemployed people
------------------------       X 100
labor force


The ideal unemployment rate is 4-5%

Not In The Labor Force : 

 1. Students.
2. Prisoners.
3. Anyone in a hospital/ mental hospital.
4.Military.
5. Completely Disabled People.
6.People who give up looking for a job.
7. Homemakers.
8. Choosing not to work.
9.Retired People.

Unemployment Benefits: Only towards laid-off workers.

Cost-Push Inflation: Increase in factors of production
Ex: Price of oil, labor, and steel,

-Rise increase of resources cost.

-Output in employment will decline
while the price level is rising.

Frictional Unemployment : 
-People between jobs.
-Temporarily unemployed.
-Transferable skills.
-High school or college graduates.
-People who are fired and are looking for a job.
-People who are looking for a better job.
-Seasonal unemployment due to the time of
year and nature of the job.
-Lifeguard.
-Bus Drivers.


Structural Unemployment: -Changes in the labor force make some
skills obsolete.
-Workers who do not have transferable skills will never come back.
-High school dropouts.
-Typewriter fixer/ VCR fixer.
-workers must learn skills in order to get a job.
-Permanent loss of these jobs is creative destruction.

Cyclical Unemployment: -Unemployment caused by economic downturns
as demand for goods and services falls.
-Demand for labor falls and workers are fired and laid off.
Ex: Recession.

Frictional / and Structural cannot be avoided.

Frictional + Structural = NRM (National Rate Of Unemployment)

Full Employment (4-5%) : No Cyclical unemployment
( FE or NRM )

Okuns Law : For every 1% increase in the
unemployment rate causes a 2%
decline in GDP.

(Reasons it is bad) -The burden of unemployment is
not equally shared in society.

-It causes social unrest and is
hard on individuals in families.

Rule of 70:Calculates the opposite number
of years required to double GDP.


Inflation

Real: value of output produced in base year prices. (BP x cQ)
-can increase from year to year only if ouput increases.
-adjusted for inflation

Nominal: value of output produced in current prices (CP x CQ)
-can increase from year to year if output or prices can increase.


-In the base year, the current prices will be equal to the constant price.
-Inyears after the base year, nominal GDP will exceed real GDP.
-In years before the base year, real GDP will exceed nominal GDP.

Price Index: measures inflation by tracking changes in the price of a market basket of goods compared with that in the base year.

Consumer Price index(CPI)
measures cost of a market basket of goods of a typical urban American Family

Price from year 2 - price from year 1
---------------------------------------------     X 100
Price from year 1

GDP Deflator
price index used to adjust from nominal to real GDP.

nominal GDP
-----------------       X 100
real GDP


Inflation : general rise in price level

Deflation: general decline in price level

Disinflation: inflation rate itself declines

Real interest rate: cost of borrowing money thats adjusted for inflation.

Nominal interest rate: unajusted cost of borowing money

Demand pull inflation: "too many dollars facing too few goods" it is caused by excess of demand over output that pulls prices upward. It is triggered by an increase in aggregate demand which cause output & emplyment to rise which causes the price level to rise.

Cost push inflation: increase in factors of production
Ex: price of oil. lobor, steel.
increase in resource prices. output and emplyment will decline while price level is rising.
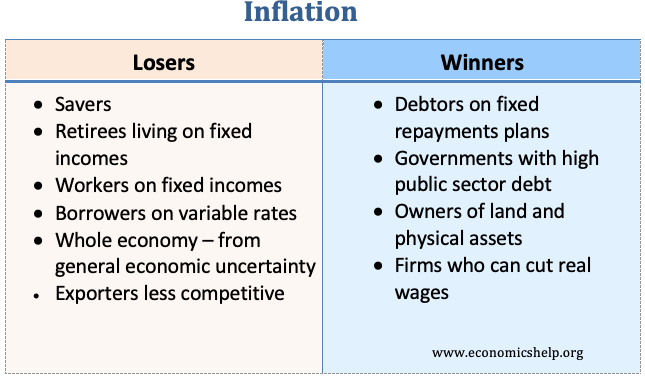
Image result for who is hurt and who benefits from inflation


COLA = costs of living adjustment
wages have risen with inflation

Shoe leather costs= increased transaction cost of shopping around

menu costs= money it costs to change prices.


GDP

GROSS DOMESTIC PRODUCT (GDP)= total market value of all final goods and services produced within a country's border within a given year.

GROSS DOMESTIC PRODUCT (GNP)= measure of what its citizens produce and whether they produce these items within these borders.

Whats INCLUDED in GDP 

C= Personal Consumption Expendentures (67%)
consumption is finished goods or services

Ig=Gross Private Domestic Investment (17%)
1.Factory Equipment Maintenance
2. New factory equipment
3. Construction of Housing
4. Unsold inventories or products built in a year

G= Government Purchases of goods and services (20%)
(schoolbuses)
Xn= Net exports (Exports- Imports) (-4%)


 C + Ig + G +Xn = GDP


What's NOT INCLUDED in GDP

1. Used or secondhand goods

2. Gifts or Transfer Payments (No output, no production)
                  ↙                     ↘
             Private              Public
        (Scholarship)       (Social Security/Welfare)

3. Stocks or bonds (no production, only financial transaction)

4. unreported business activities (tips)

5. Illegal activities or (underground activities)
-blackmarket

6. non-market activities
-babysitting
-bartering +trading

7. Intermediate goods
-tires, wheel parts of a car


GDP formulas:


Expenditure Approach

C+Ig+G+Xn=GDP

Income Approach

Wages+ Rent + Interest + Profits+Statistical adjustments= GDP


Trade = (Exports - Imports)

Positive # = Surplus
Negative # = Deficit

Budget = (Government purchases + transfer payments - government tax + fee collection)
Positive #= deficit
Negative # = surplus


National Income:

method 1

(Compensation of employees + renters income + proprietors income + interest income + corporate income)

method 2 

GDP - indirect business taxes - net foreign factor payment - depreciation

Disposable Personal Income (DPI)

(National income - personal household taxes + government transfer payment)


(Depreciation is the SAME as Consumption of fixed capital )

GNP = GDP + nation foreign factor payment

NNP = GNP - depreciation

NDP= GDP - Depreciation

Gross Private Investment (Ig)= NDPI (net domestic private investment) + Depreciation


Wednesday, October 16, 2019

Circular Flow

Circular Flow Model- Shows the money, goods and services, and factors of production through the economy.

Related image
Household= Person or group of people who share income. Households own factors of production.
(land, labor, capital, entrepreneurship.)

Firms= organization that produces goods & services for sale. Firms produce goods by taking inputs (factors of production) & turning them into outputs (finished products)

Government= providers of public goods & services and demanders of both private & public goods as well as factors of production.

Products market= where goods & services are bought and sold.

Factor Market/Resource Market= where factors of productions are bought and sold. (capital & labor)


⭐UNIT 2! Business Cycle

Business Cycle: A fluctuation in economic activity that an economy experiences. period of time.

      --Four Phases in a Business Cycle--
                 *1st Phase- Expansion- a period of economic upturn when OUTPUT &  EMPLOYMENT  RISES. (GOOD)
                *2nd Phase Peak- HIGHEST point of real GDP, Near or at full employment.
                *3rd phase  Contraction/Recession- real GDP DECLINE for at least 6 months
                *4th Phase  Trough- the LOWEST point of real GDP least amount of spending and HIGHEST unemployment.
Image result for business cycle


Balance of Payments

Balance of Payments : measure of money inflows and outflows between the U.S and the rest of the world. (ROW) - Inflows are referred to as...