PRODUCTION POSSIBILITIES CURVE curve on the graph
PRODUCTION POSSIBILITIES FRONTIER= PPG
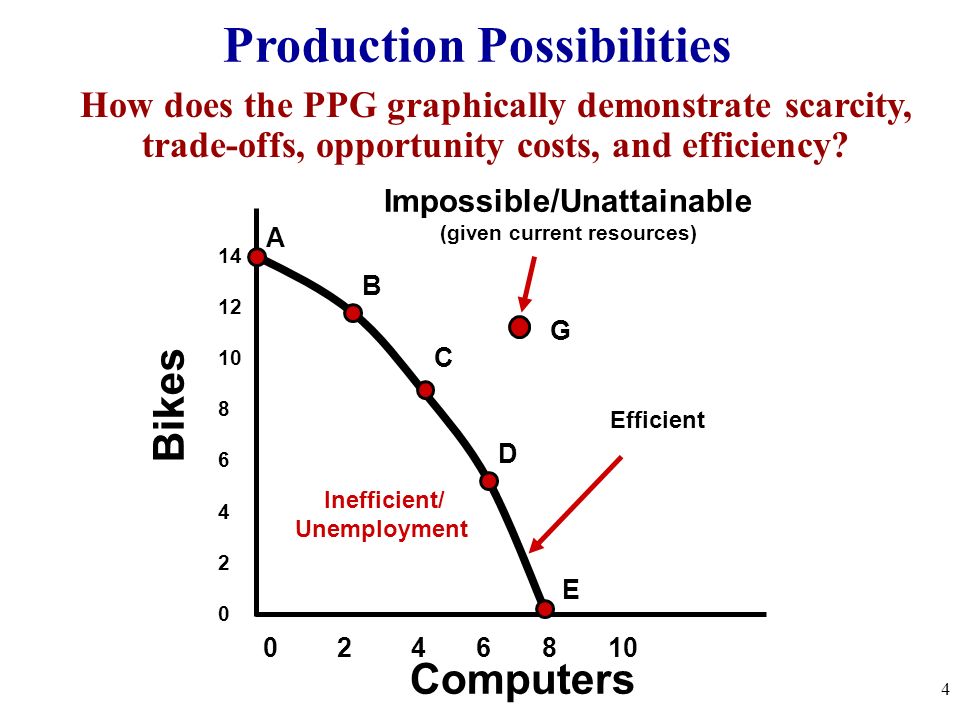
Key assumptions about PPG:
1. full employment= 4-5% unemployed, 90% factory capacity.
2.Fixed resources:
land, labor, capital
Fixed state of technology
No international trade
two goods are produced ( can't have more than 2 at a time.)
3 movements inside PPG
Shift inside PPC
Shift outside PPC
Shift on the PPC
Allocative & Productive Efficiency
Allocative efficiency: products being produced are ones most desired by society.
Productive efficiency: products being produced in the least costly way.
/what-is-balance-of-payments-components-and-deficit-3306278-Final1-c67946023d0f4cdcb7e7794de02947bc.png)


No comments:
Post a Comment